

Why the P/E ratio is not important...
Why the P/E ratio is not important...
...for quality growth companies

A common practice among many investors these days is to focus almost exclusively on price ratios to determine if a stock is underpriced or overpriced. If you are focused on quality growth companies this behavior will make you miss many interesting opportunities.
In this article I will provide some examples of why it may be a mistake focusing on these ratios for quality companies. I’ll focus on the P/E ratio.
For those of you who don’t know, the P/E ratio measures at what multiple the stock is trading with respect to the Earnings per Share (EPS) of the company. Let’s take a look at an easy example: a stock is trading at a price of $180 and has EPS of $5 per share. The stock’s P/E ratio is 36 ($180/$5). You can find two main P/E ratios:
P/E (TTM): this ratio is calculated taking the EPS of the last 12 months (TTM stands for “Trailing Twelve Months”). Also called “Trailing P/E”.
P/E (NTM): this ratio is calculated taking the EPS that are estimated for the next 12 months (NTM stands for “Next Twelve Months”). Also called “Forward P/E”.
This means that if a company is expected to grow earnings then the Trailing P/E (TTM) should be higher than Forward PE (NTM) as the denominator will be getting bigger, making the ratio shrink (EPS will be growing). Here you have the example of $FB:
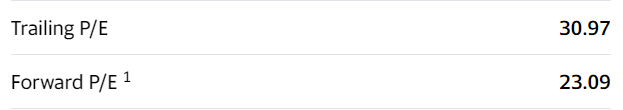
Source: Yahoo! Finance
As Facebook is expected to increase EPS during the next 12 months then the Forward P/E is smaller than the Trailing P/E.
Once we have finished this brief explanation its time to see why P/E ratios may mislead growth investors.
Earnings can be low for many reasons
As most of you will know, every euro the company spends is accounted for in earnings (as earnings is the bottom line every expense is substracted from revenue to calculate earnings) and thus earnings can be low for many reasons. Analyzing why earnings are low is key to know if a high P/E ratio means that the stock is clearly overvalued or if, on the contrary, it’s good news (yes, low EPS can also be good news for the long run).
Some weeks ago I published this slide on my Twitter account to illustrate the difference between a desirable and an undesirable P&L for growth companies:
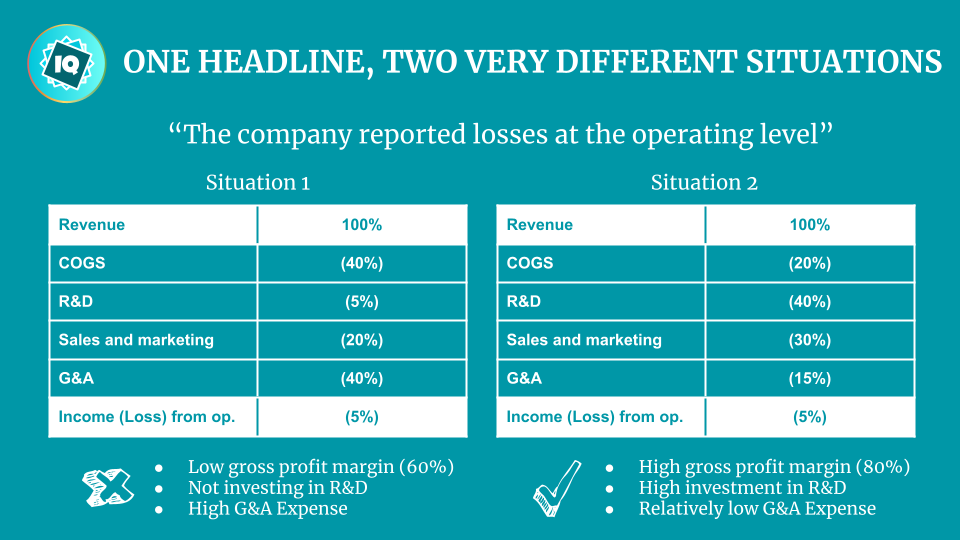
In situation 1 the company is spending a huge percentage of revenues on:
Cost of revenue (COGS): Gross profit margin is 60% which is lower than what you should aim for. With such great businesses out there you should not settle for less than a 70% gross profit margin.
General and Administrative expenses (G&A) are high. This is probably caused by an undesirable cost structure. Every dollar spent on G&A is a dollar that the company can’t spend to fund future growth.
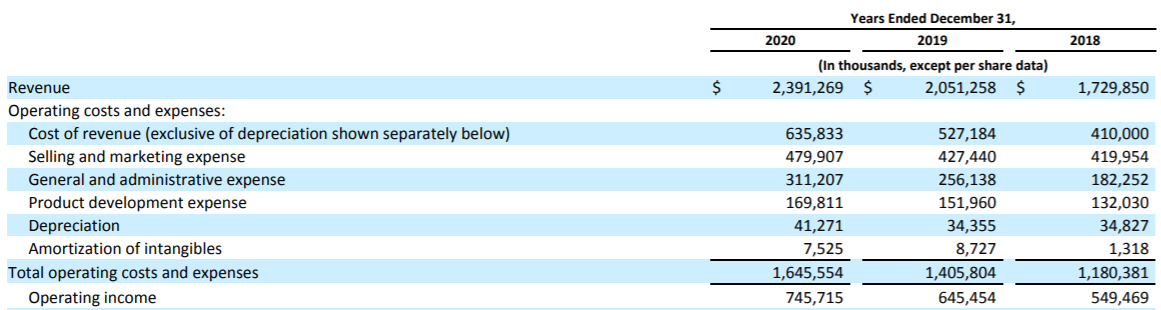
Match Group ($MTCH) is an example of a desirable cost structure as G&A expenses are shared by many apps. G&A as a percentage of revenue for 2020 is 13% (you can calculate it yourself from the image below):

Source: Match Group’s 10K
In situation 2 the company has a completely different cost structure, enjoying a gross profit margin of 80% and spending 40% of revenues on Research and Development (R&D). Notice how G&A expenses in this situation is just 15% of revenues.
The company in this situation has the ability to boost earnings whenever they want by simply cutting R&D investments as a percentage of revenue. Do you want an example? $AMZN. The company’s earnings had been many years flat because they were investing every single dollar of profit on future growth:
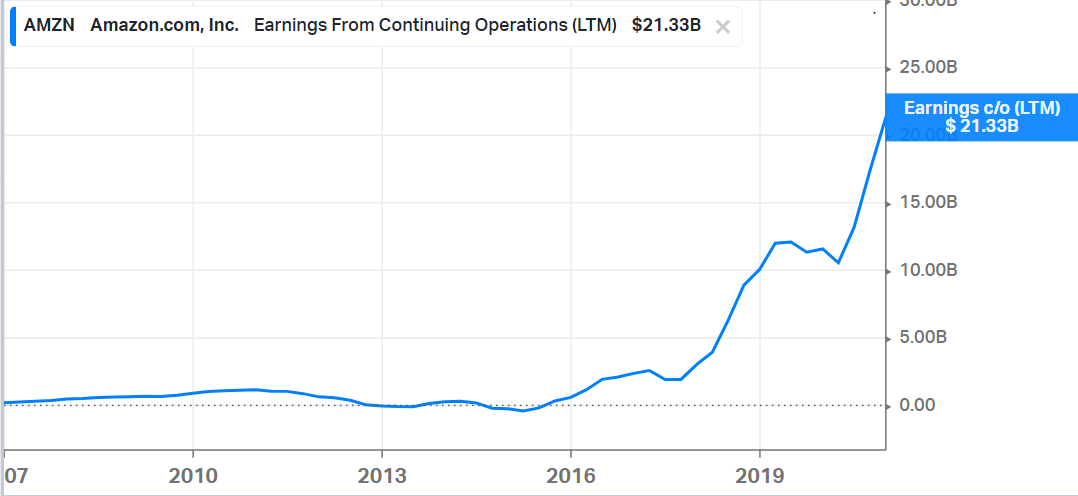
Source: Koyfin
See how they can boost earnings once they decide to spend less on R&D? Low quality companies never have this opportunity.
These two situations are completely different from a business perspective but will probably throw out a similar level of earnings (as a percentage of revenue). I would obviously expect the company in situation 2 to trade at a much higher P/E multiple. If these two companies trade at a similar P/E multiple I think there is no doubt where to invest if you had to chose between both.
Earnings don’t drive shareholder returns, revenue growth does
Why would you focus on earnings when there are studies that show that the main contributor to shareholder returns in the long run (i.e. stock appreciation) is revenue growth?
In the following graph you can see the results of a study conducted by BCG:
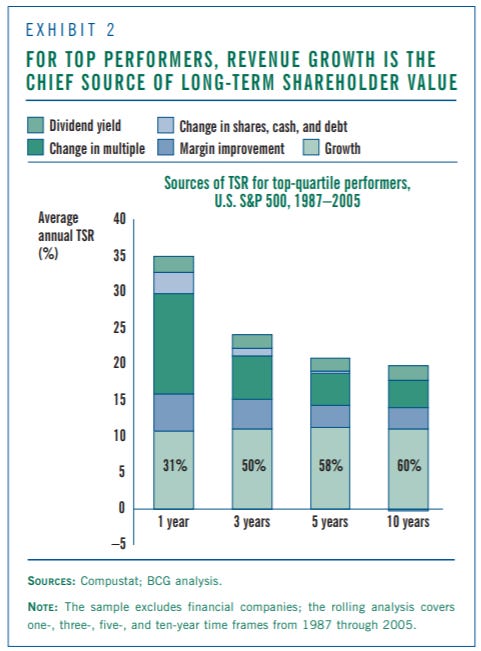
According to this study revenue growth accounts for 60% of long-term shareholder value.
The study is outdated but nothing has changed since (I think there is un updated study that shows that revenue growth is even more important, around 70%). Remember what John Templeton said?
“The four most dangerous words in investing are: “this time it’s different””
I’ll provide a couple of examples so that you can see the correlation between revenue growth and stock price appreciation:


You can find plenty of examples such as these. This obviously does not mean that unprofitable businesses are great investments if they are simply growing revenue but if you invest in a business with a desirable cost structure (companies in situation 2) and big expected revenue growth, chances are that you will do well.
Technology allows companies to scale quickly
There are many tech companies that are not showing profits but investors are pricing in their ability to scale up quickly. What does this mean? They can eventually satisfy the needs of many more customers without incurring in proportional higher costs. Many of them will take advantage of powerful network effects as they grow.
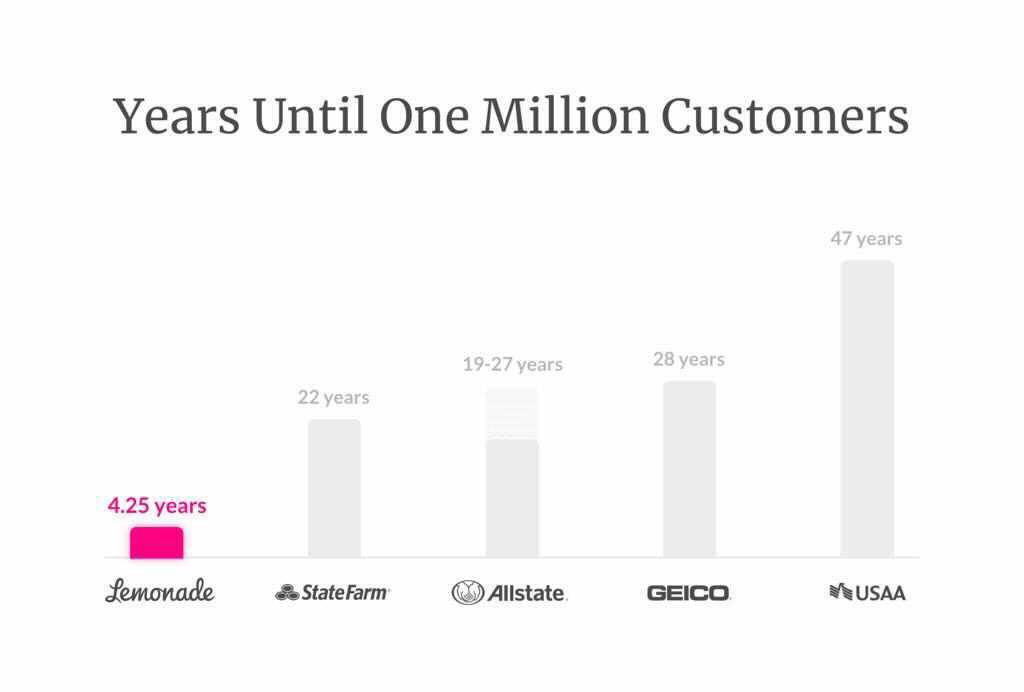
Take the example of Lemonade ($LMND), an insurance company that plans to disrupt the insurance industry. They are a really young company and they are still not showing a profit but the insurance market is huge and the fact that their product is entirely offered through a digital channel (mobile app) allows them to reach customers very quickly. Strong customer growth joint with wide margins and desirable cost structures will eventually lead to profitable businesses. Lemonade took just 4.25 years to reach the 1 million customer milestone:
Be careful here because growing fast can be fatal for unprofitable business models as they will be destroying value with every customer they add.
Experience shows that focusing on P/E ratios would have made you lose incredible opportunities
If you backtest these findings you’ll see many opportunities that were lost by investors focusing on P/E ratios. Two clear examples: $AMZN and $NFLX.
Amazon ($AMZN)
On July 2017 you could’ve bought Amazon at a P/E ratio of 122.6x but probably many investors didn’t do it because they thought that this was too high. Amazon has returned approximately 306% since that date.

Source: Koyfin
Netflix ($NFLX)
On July 2017 you could’ve bought Netflix at a P/E ratio of 131.8x but probably investors thought the that this was too high. Netflix has returned 298% to investors since that date.

Source: Koyfin
If you are still skeptical then you can take a look at this slide form Fundsmith’s shareholder presentation (another great source of information):

Source: Fundsmith
This graph illustrates the P/E ratio you could’ve paid almost 50 years ago to achieve a 7% CAGR. You can see pretty high numbers here and well known companies.
And now what?
I hope that you don’t base your investment decisions on P/E ratios anymore after reading this article, specially if you are focused on companies that have a long growth runway ahead.
This said, I know it is really difficult to ignore a P/E ratio of 150x while the media and all the bears tell you that P/E ratios have never been this high and the greatest bubble in history will occur next week. But you can do it.
There are many other ratios that you can look at that will help you better analyze if a company is trading cheap or expensive although none of them are perfect and they should never be looked at in isolation:
P/S ratio (Price to sales): multiple of price to revenue per share of the firm. Good ratio for growth stocks although the ratio itself will not tell you much about the valuation of the company.
I wouldn’t recommend companies trading at more than 60x P/S because they carry a lot of downside with them. However, companies trading at high P/S can turn out to be great investments. Take Crowdstrike ($CRWD) and Cloudflare ($NET), I think they will bring a lot of value to shareholders even if they are bought at these multiples.
P/CF (Price to cash flow): multiple of price to operating cash flow per share. Specially useful for firms that are not profitable on an earnings basis yet (due to high non-cash charges) but are generating positive generating cash flow.
This could be useful for example for companies such as Pinterest ($PINS) as they have a big amount of share-based compensation (non-cash charge). If you want to take a look at my analysis of Pinterest you can do that here.
I want to end the article with a tweet by Ian Cassel:
“The lower you go in quality, the more important valuation becomes.”
Thank you very much for taking your time to read this, if you liked it feel free to share!
Stay well!
Disclaimer: nothing posted here is investment advice. I’m long $MTCH, $LMND, $AMZN, $FB, $PINS, $CRWD and $NET